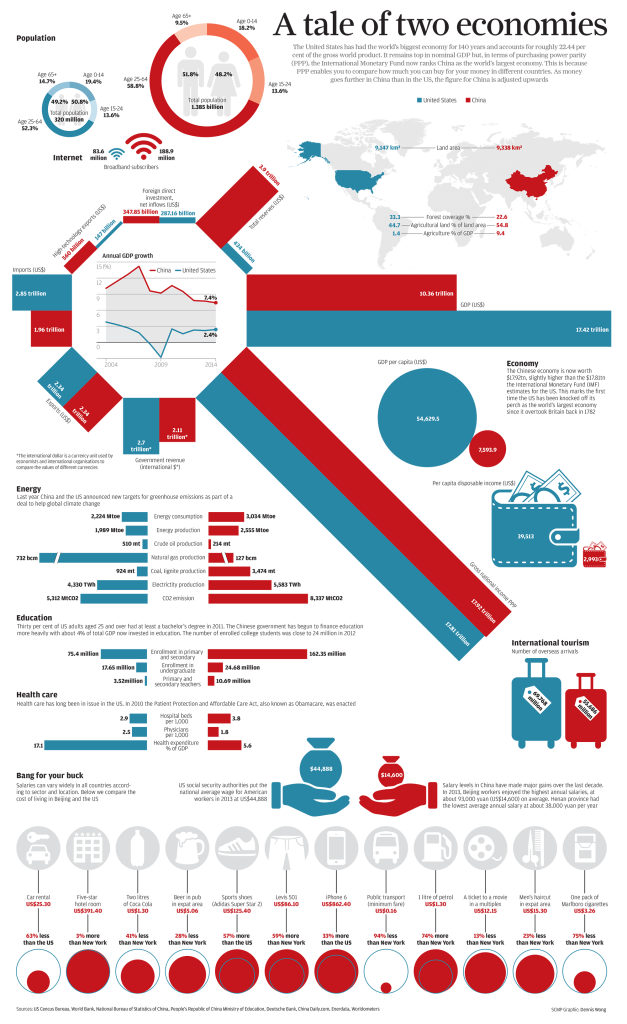
According to the IMF, in terms of PPP (purchasing power parity) Chinese economy has surpassed that of US. PPP comparison is designed to measure relative differences between economies based on how much money can buy in each country that is being compared.
Most popular example of PPP based scale is a Big Mac index, popularized by The Economist. Most commonly, the baskets of goods are used to compare purchasing power across countries.
This recent infographic by SCMP (South China Morning Post), Hong Kong newspaper that was recently acquired by Alibaba, shows the comparison of the economy of China vs. US.
For example, it shows, that in GDP terms, Chinese economy is still significantly smaller than US, $10.36T vs. $17.42T. However, in PPP terms, IMF puts China slightly ahead of US for the first time: $17.92T vs. $17.8T.
Of course, considering that China’s population is about 4 times larger, the GDP per capita is only $7,593 vs. America’s $54,629.
The infographic than makes some interesting comparisons between different goods and services in China vs. US using Beijing and New York and the representatives for each country. For example, it turns out that most clothing, shoes and gas are more expensive in Beijing. However, transportation, is significantly cheaper in China, up to 94% difference in the case of public transport.
Click here for high resolution graphics.


